Assess performance at different seeding rates
Soybean Corner: Did cutting seeding rates affect yield potential this year?
Jul 06, 2022
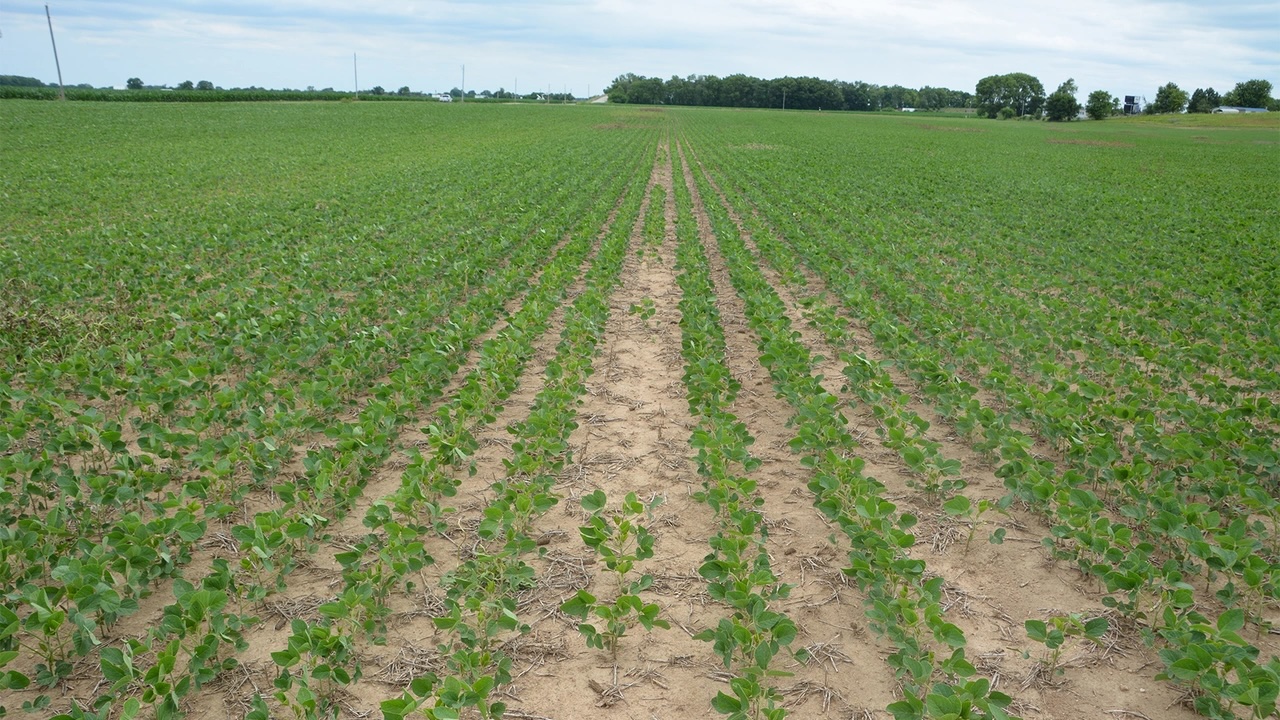
We cut back to 110,000 seeds per acre from 150,000 for soybeans. We stayed at 150,000 in half of two fields. Can we make comparisons now to determine which seeding rate might be better? Or is it strictly wait on yields?
The Indiana certified crop advisers answering this question include Betsy Bower, agronomist for Ceres Solutions, Lafayette; Shaun Casteel, Purdue Extension soybean specialist; Greg Kneubuhler, G&K Concepts Inc., Harlan; and Bryan Overstreet, Purdue Extension educator, Jasper County.
Bower: Use the quick method from Shaun Casteel. It involves counting 10 spots in a field but only counting 1/1,000 of an acre.
For drilled soybeans, count four rows that are 17 feet, 5 inches long to represent 1/1,000 of an acre. For 15-inch rows, count two rows of the same length. In 30-inch rows, count just one row, same length.
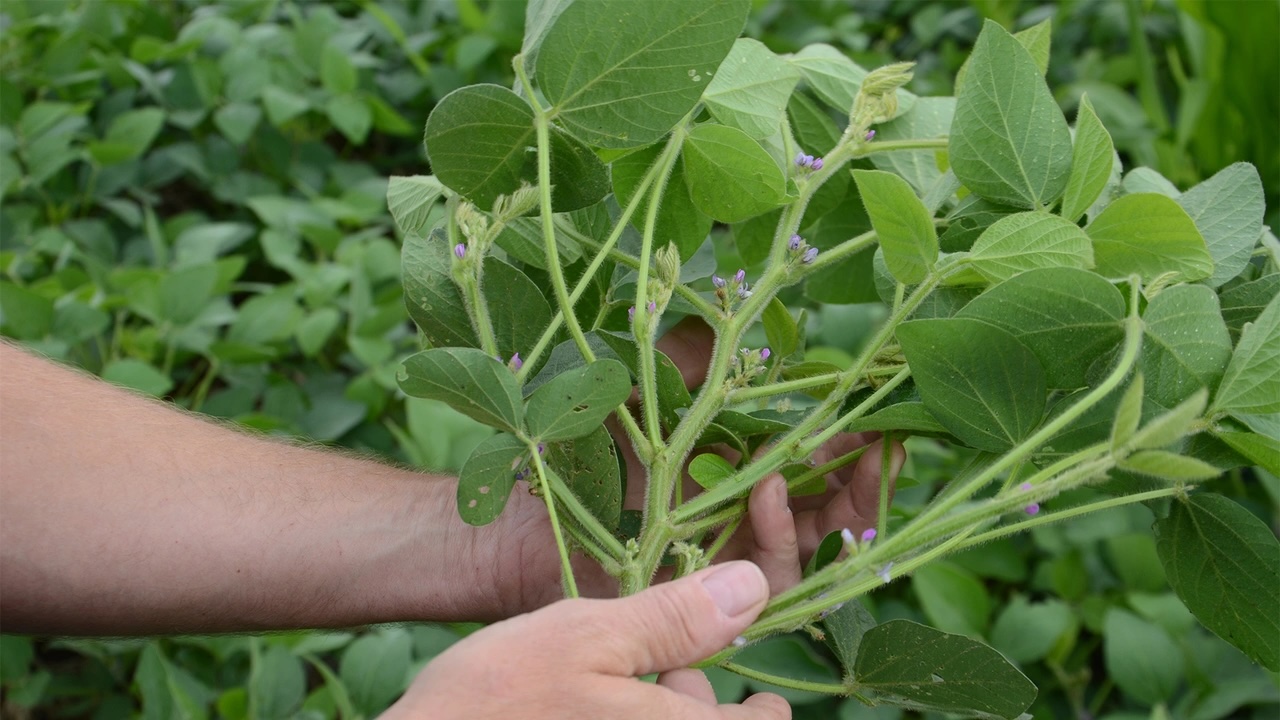
Count pods on 10 randomly selected plants. Multiply plants per acre by average number of pods per plant. Multiply by 2.5 to estimate seeds per acre. Divide by 2,900 seeds per pound for pounds per acre. Finally, divide pounds per acre by 60 for bushels per acre.
Still, this will only provide an average estimated yield for different planting populations. But the estimate will help you see if there are major differences between planting rates and get a feel for 2023 seeding rates to take advantage of early seed discounts.
Kneubuhler: Our data has shown lower rates are optimum. The key is uniformity of stand. When you have inconsistency, lower seeding rates get you in trouble. Make observations in your split fields between the two rates in terms of branching and pod set. Ultimately, taking it to yield is the final grade card.
Another thought process is seeding rates tied to planting dates. Obviously, if we plant early and go through tougher conditions, a higher seeding rate as an “insurance policy” is not a bad move. As we move later with warmer soils and less risk of stress, a lower seeding rate becomes easier to accept.
Overstreet: Compare disease and weed issues in both populations. Do yield checks on both populations to get an estimate before harvest. Follow Betsy Bower’s instructions for estimating yields. During harvest, compare lodging and keep track of yields. Many years, you will not see an economic yield difference until you get below 75,000 to 80,000 plants per acre.
Casteel: Seeding rate comparisons must account for planting date and emergence. Hopefully, stand counts were taken in June to compare establishment rate with seeding rate. If not, stand counts can be taken near harvest to determine final plant population. Compare to final yields.
Some soybeans outcompete others. Weaker plants often die. Such plant loss is around 5% to 15%, depending on initial stand and uniformity in development. More discrepancy in plant growth and development results in more plant loss. An early stand of 100,000 plants per acre may become around 90,000 at harvest.
The best comparisons among seed rates center on early-season stand; establishment rate; aerial, drone or smartphone imagery to determine time for closing rows; plant stands near harvest; and yield monitor results. Canopy closure relative to vegetative stages and transition to flowering integrates field conditions. Ideally, we want rows closed by R2, full bloom. Comparisons now give an early indication of reproductive branching, pod development and early seed fill. The following 30 to 45 days will have a major impact on final yield.


